

Anyone who spends time on this blog realizes that it is focused on getting HR involved in impacting the bottom line of the organization. Since we are the “people” department, this means that productivity should be a major concentration of our efforts. Previous posts have shared that the World Economic Forum states that productivity will be the primary focus of business for the next decade or more.
The organization that can increase productivity (producing more product or service while combining less resources) is the organization that is positioned to win. It has a competitive advantage in the cost of its product/service, more flexibility in reacting to changes in the business environment, and increased ability to reward or incent it’s talent pool.
Nowhere is the need for a focus on productivity more critical than healthcare. Healthcare is labor intensive. (Imagine if your grocery story required 4 employees to handle each customer!) It is highly competitive and undergoing constant changes from third parties such as insurers and governments.
I have also written on why I believe that the management of productivity belongs in HR. Historically, we have held to the idea that HR’s primary function is to supply and manage the human resources of the organization. We have focused on screening and delivering qualified staff and then working to keep them happy and satisfied.
Don’t get me wrong–this is truly critical. However, that is where we stop. We have ignored how productive or effective they are to be after they are hired–what kind of value we are getting for our investment. We have ignored whether or not the work itself is worthwhile, satisfying, or logically performed. We have focused on the people and ignored the work. After all, we reason, this is the function of the line manager.
Of course the line manager should know the work best. A Physical Therapist will obviously know more about what a Physical Therapist should do than an HR minion. However, who owns the tools of process improvement, how to monitor and improve productivity, how to incentivize the staff for greater results? Who can teach or lead the line managers in creating a high performance, always learning workforce? Depending upon the line manager who most likely was trained in his/her discipline seems very hit or miss.
Who can link compensation, reward and recognition programs to actual measurable results?
, HR sells itself short by standing on the sidelines when it comes to obtaining operational results. HR should be the inhouse resource for the constant improvement of work processes and productivity in terms of winning for organization (profitability) and for the employees (satisfaction/engagement).
As we know, increasing productivity does not mean a management edict for employees to “work harder”. Making bricks without straw is how one employee described it.
The best way to improve productivity is not manipulation of the employee, but rather a focus on improving the work that the employee is being asked to do. In other words, process improvement.
Whenever I have embarked upon a work improvement project , it always started by creating a flowchart of the existing process(es). Improvements will not come out of the air or by divine inspiration, but come from an examination of the process as it currently exists.
And, I might add… Every single time that a flowchart was created of a work process, at least one improvement became evident solely as a result of creating the chart! This was without exception.
That is why I consider flowcharting as the #1 tool for increasing productivity and employee satisfaction. Any HR professional that wants to be involved in working with process improvement needs to have the ability to create and use a simple flowchart. Here are the basics:
What is a flowchart?
What is a flowchart and why is important? A flowchart is simply a process in picture form that shows the steps and decision points needed to make the process work. When we put a process in picture form, it becomes easier to analyze and find ways to improve the process.
Creating a flowchart is not difficult and every manager should be able to create one. Flowcharting should be part of your management training. There are some great software programs for creating flowcharts. Your department needs one. I am a big user of Microsoft Visio which is useful for all sorts of charts including flowcharting, org charts, etc. Some use PowerPoint but I think Visio is more robust for more complex charts.
There is a lot of good resources available on how to create a flowchart, but some of it gets too detailed by covering techniques and flowchart variations that you will never use.
Flowchart Components
Here is all you need to know to create a basic process flowchart:
- Use an OVAL to indicate the beginning and ending of the process
- Use a RECTANGLE to indicate each action
- Use a DIAMOND to show each decision step in the process. Each decision should be in the form of a yes/no question.
- ARROWS are used to link the action or decision steps to the next step in the sequence.
- If a process cannot be displayed in one column or on a single page, use numbers in SMALL CIRCLES to indicate continuations
Using the four (or five) symbols above enable anyone to draw a basic picture of any given work process whether it is passing meds, registering a patient, onboarding a new hire, cleaning a vacant room, etc.
The starting and ending points for many processes will be self-evident. At other times, you may want to consider a limited part of a more comprehensive process. A good example would be this: Would you want to flowchart the new hire process from job posting to first day on the job? That would be overwhelming and require a flowchart that would continue for multiple pages.
We would probably limit our flowcharts to logical segments that are easier to flowchart and analyze. For example, we might flowchart the following separate processes that make up recruitment: Position Approval/Posting, Candidate Processing, Onboarding, etc. Each becomes more manageable and is still a process in itself.
Creating the flowchart
There are two ways you can use flowcharting: (1) to define the process as it should be done. This approach would be used for inclusion in policy & procedure manuals or for training, or (2) to illustrate the process as it is actually done. This approach is used to uncover process problems or opportunities for improvement.
If you want to improve the process forget how it is supposed to be done and diagram how it is actually done-warts and all.
The best approach to uncovering how the process flows, is to create the flowchart using all or a representative group of those who are involved with the process. Having one employee create the flowchart is not wise: s/he will only describe how s/he does the work. A group approach works best as it will also reveal individual variations that may be occurring as different employees execute the process.
The group can use the following steps to create a flowchart:
- Decide on the starting and ending steps
- Write the starting step in an oval.
- Ask “what happens next?” and write each step in a rectangle.
- When a step requires a decision, write it as a yes/no question in a diamond. Develop a path for both the yes and no choices.
- Write the end step in an oval.
Sample flowchart
Here is a simple flowchart:
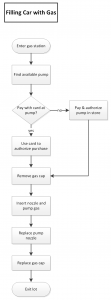
We made this very simple. You can see that there could be more detail. Gas choice, credit card info inputting, receipt printing, etc. could all have been steps or worded as choices. The flowchart can be as detailed as needed.
In summary, a flowchart is created by simply asking “what happens next?” If the next step requires a decision then it is worded as a yes/no choice and each option is charted to its endpoint.
Using the flowchart
This post is focused on how to create a flowchart. As already stated, there could be several goals:
- Define the right way to perform a process (or task). By developing the right way to do a process, quality is assured. A “systems approach” assures quality by building it into the way it is done. One large clinic had a goal of flowcharting at least 80% of all the patient care processes by the end of the year.
- Identify improvement opportunities by charting how it is presently being done.
Even though using the flowchart to improve productivity is another subject, it is easy to see how examining a visual depiction of the process can lead to improvement. The question can be asked of each step “can this be eliminated?”
If we were more detailed in our example above, we see that the simple act of using a credit card involves multiple steps of swiping card, inputting PIN, etc. Elimination of these steps simplifies the process, reduces cycle time and potential errors.
Additionally, if a gas cap could be invented that did not have to be removed when filling the automobile, two steps could be eliminated.
There you go–looking at our example highlighted a way a technological change could improve the process. Invent a gas cap that has an opening that could open and close for the nozzle would improve the process.
The same thing will happen when you start flowcharting for process improvements. You will find redundancies, unnecessary steps, wasteful geographic workflow (people, materials, information), etc.
Streamlining processes and reducing cycle time of work processes should be the subject of more posts. It also should be a focus of the management function in your organization. It is win-win for everyone. Reducing cycle time always benefits the customer whether internal or external. Employee satisfaction increases with improved work processes. Quality should always benefit.
Oh, did I mention profitability? HR wants a seat at the table. It starts with making things better. I guarantee that making things better will include flowcharting.


